We can use variables in Grafana to manipulate time-ranges that are used as inputs to MobilityDB queries. We'll create a drop-down type variable called FromTime that will be used as an input for the time period within which a query returns results.
In the dashboard window, click
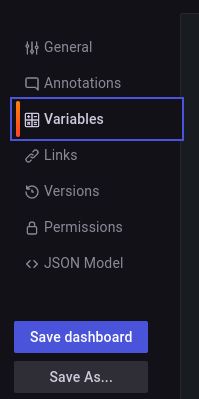
Dashboard settingsicon; the gear symbol, on the top-slightly-right of the window.Click on the
Variablesin the next window on the top-left side of the screen.You'll see a screen that explains the variables in Grafana and also points to the Templates and variables documentation. Click on the
Add variablebutton.In
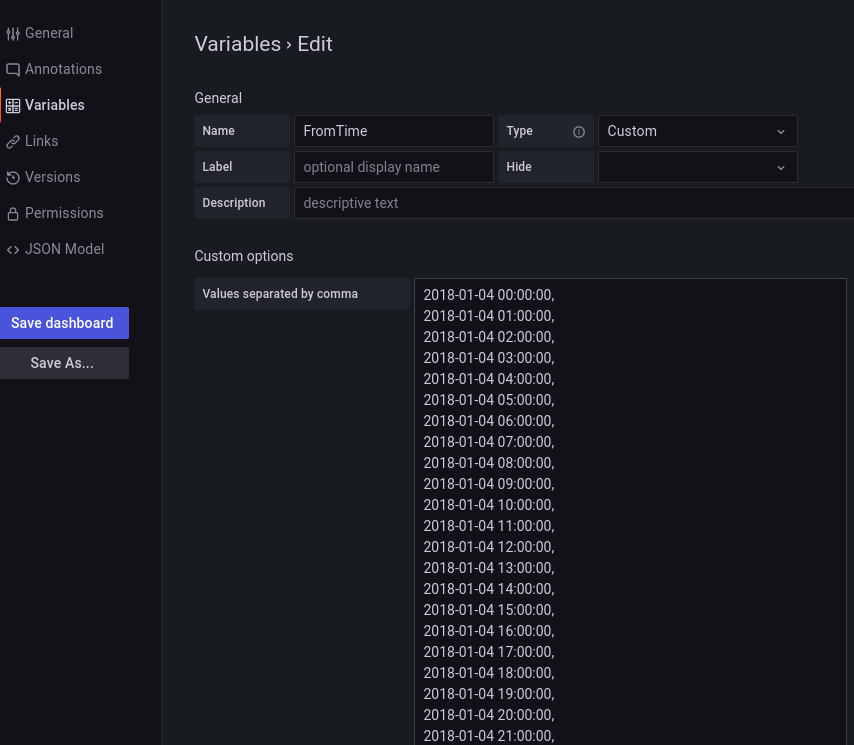
GeneralName → FromTime
Type → Custom
In
Custom optionswe will manually add all the time ranges with 1 hour increment. e.g.2018-01-04 00:00:00, 2018-01-04 01:00:00 … 2018-01-04 23:00:00You get a screen like below. Towards the bottom there is also a
Preview of valuesthat shows what the drop-down options will look like for the variable you created. In this case, we are creating the timestamps in the same format that MobilityDB will accept.We can create another variable called
ToTimewith values shifted 1 hour. So the starting value would be2018-01-04 01:00:00and the final value will be2018-01-05 00:00:00.

Now we can modify some queries by including the newly created variables which will return results from a specific time window. We have now provided a user with the ability to dynamically modify visualization queries and slice through time.
In the query code we just need to make slight changes for it to take time values from the variables. In the original query, shown below:
SELECT P.port_name,
  sum( numSequences( atGeometry( S.Trip, P.port_geom))) AS trips_intersect_with_port,
  p.lat, p.lng
FROM ports AS P, Ships AS S
WHERE eIntersects(S.Trip, P.port_geom)
GROUP BY P.port_name, P.lat, P.lng
We just need to modify the trips_intersect_with_port parameter in the SELECT statement to look like:
sum(numSequences(atGeometry(atTime(S.Trip, tstzspan '[$FromTime, $ToTime)'), P.port_geom)))
  AS trips_intersect_with_port
Essentially we just wrapped S.Trip with atTime() and passed our custom tstzspan range. The full query with this modification is below:
-- Table with bounding boxes over regions of interest
WITH ports(port_name, port_geom, lat, lng) AS (
  SELECT p.port_name, p.port_geom, lat, lng
  FROM (VALUES
    ('Rodby', ST_MakeEnvelope(651135, 6058230, 651422, 6058548, 25832)::geometry,
      54.53, 11.06),
    ('Puttgarden', ST_MakeEnvelope(644339, 6042108, 644896, 6042487, 25832)::geometry,
      54.64, 11.36)) AS p(port_name, port_geom, lat, lng))
SELECT P.port_name,
  sum(numSequences(atGeometry(atTime(S.Trip, tstzspan '[$FromTime, $ToTime)'),
    P.port_geom))) AS trips_intersect_with_port,
  p.lat, p.lng
FROM Ports AS P, Ships AS S
WHERE eIntersects(S.Trip, P.port_geom)
GROUP BY P.port_name, P.lat, P.lng
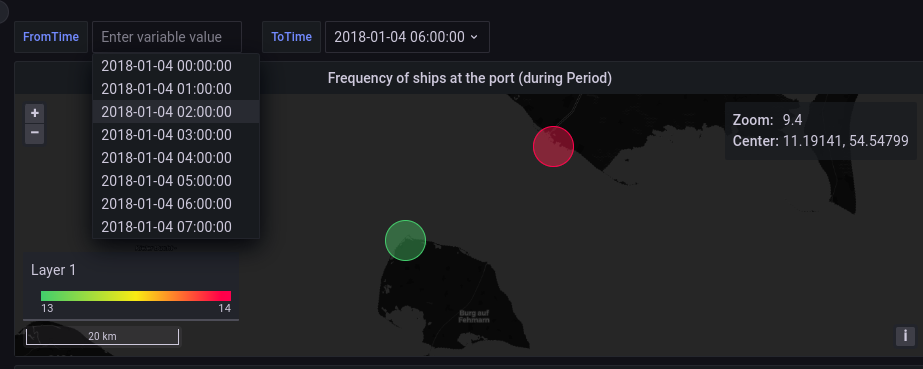
We can select the start time, FromTime → 2018-01-04 02:00:00 and ToTime → 2018-01-04 06:00:00. As we can see below, the port Rodby has less activity during this period and that's why it is green now. But overall Rodby has more activity so when we look at the entire days data it is colored red.
Grafana also has some built-in variables (global variables) that can be used to accomplish the same thing we did with custom variables. We can use the global variables ${__from:date} and ${__to:date} instead of the $FromTime and $ToTime we created. The time range can then be modified with the time range options in the top right of the dashboard.
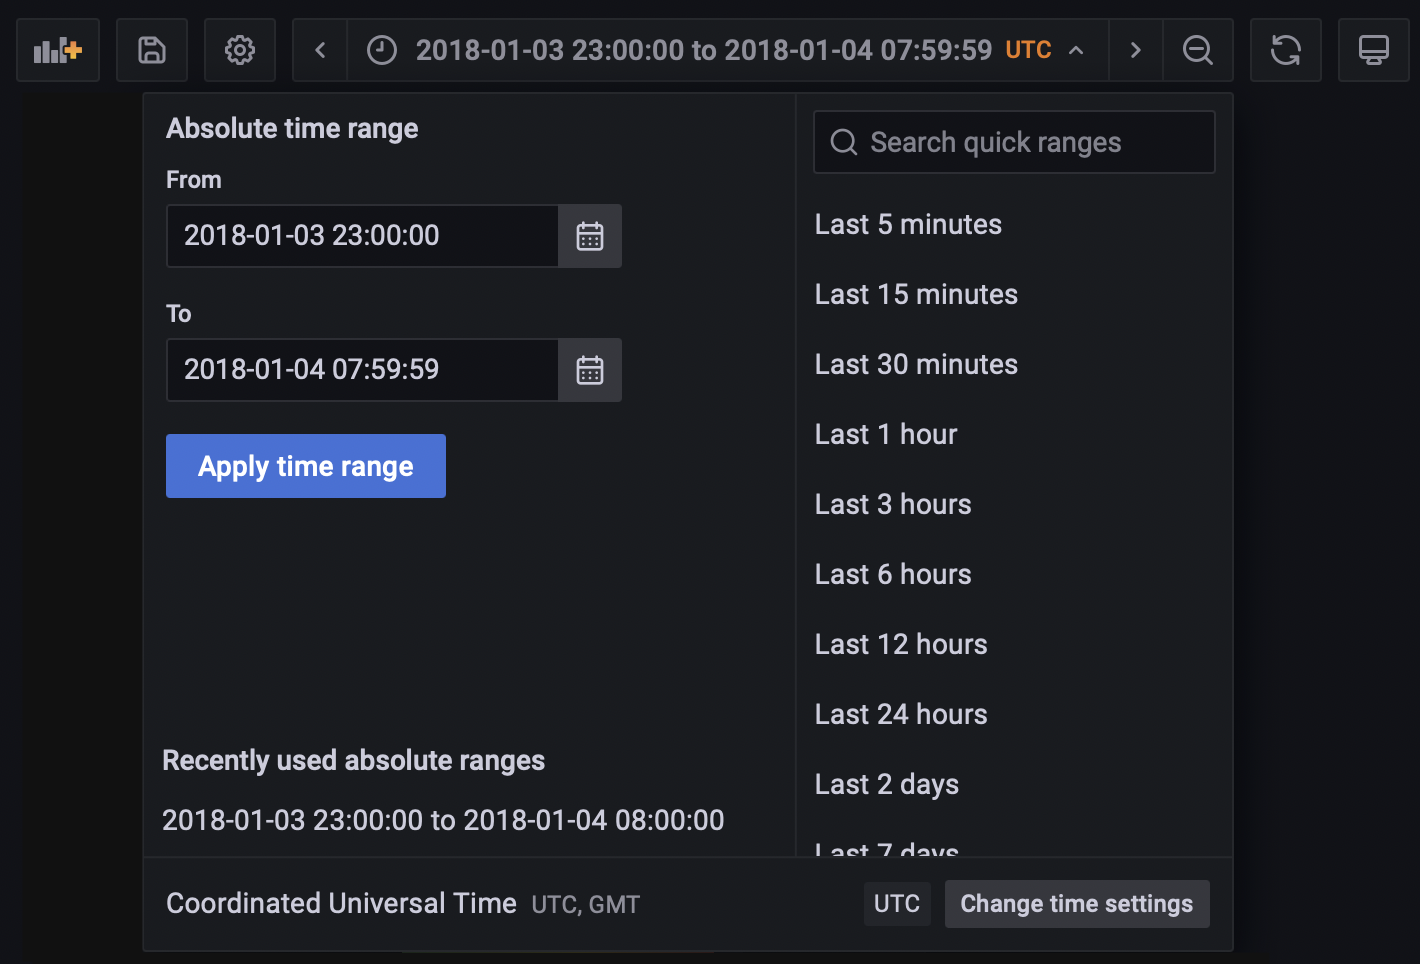
Note: It is important to be aware of the timezone used for the underlying data relative to the queries for global variables. Time zones can be adjusted at the bottom of the time range selection, Change time settings. For this example, we change the time zone to UTC to match our dataset.