Split the bounding box in quadrants or octants
quadSplit(stbox) → {stbox}As indicated by the
symbol, this function is a set-returning function (also known as a table function) since it typically return more than one value.
SELECT quadSplit(stbox 'STBOX XT(((0,0),(4,4)),[2001-01-01,2001-01-05])');
/* {"STBOX XT(((0,0),(2,2)),[2001-01-01, 2001-01-05])",
   "STBOX XT(((2,0),(4,2)),[2001-01-01, 2001-01-05])",
   "STBOX XT(((0,2),(2,4)),[2001-01-01, 2001-01-05])",
   "STBOX XT(((2,2),(4,4)),[2001-01-01, 2001-01-05])"} */
SELECT quadSplit(stbox 'STBOX Z((0,0,0),(4,4,4))');
/* {"STBOX Z((0,0,0),(2,2,2))","STBOX Z((2,0,0),(4,2,2))","STBOX Z((0,2,0),(2,4,2))",
   "STBOX Z((2,2,0),(4,4,2))","STBOX Z((0,0,2),(2,2,4))","STBOX Z((2,0,2),(4,2,4))",
   "STBOX Z((0,2,2),(2,4,4))","STBOX Z((2,2,2),(4,4,4))"} */
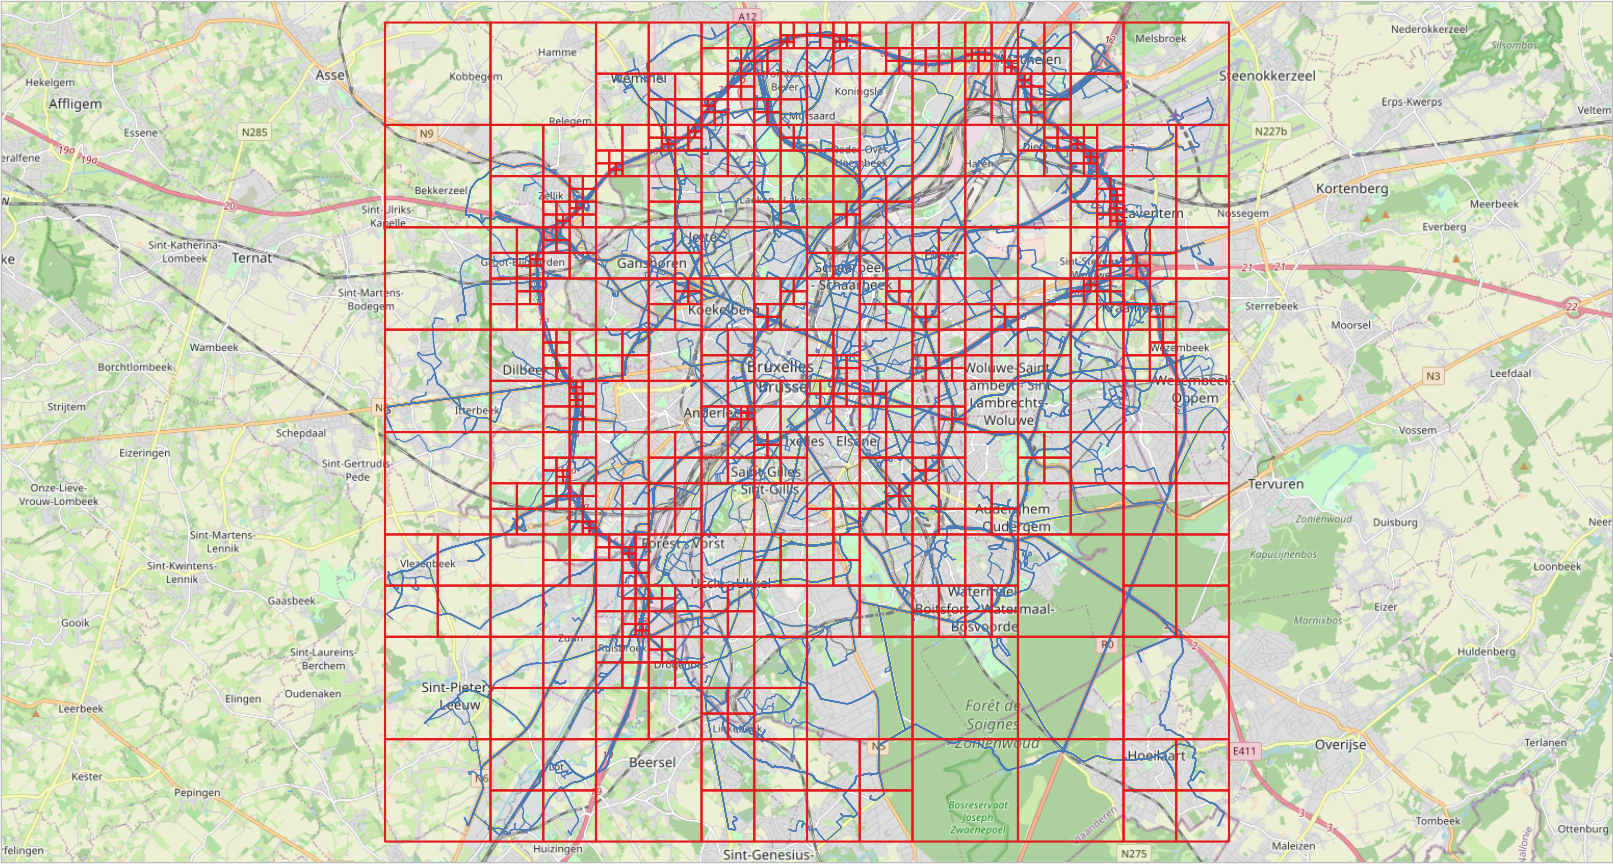
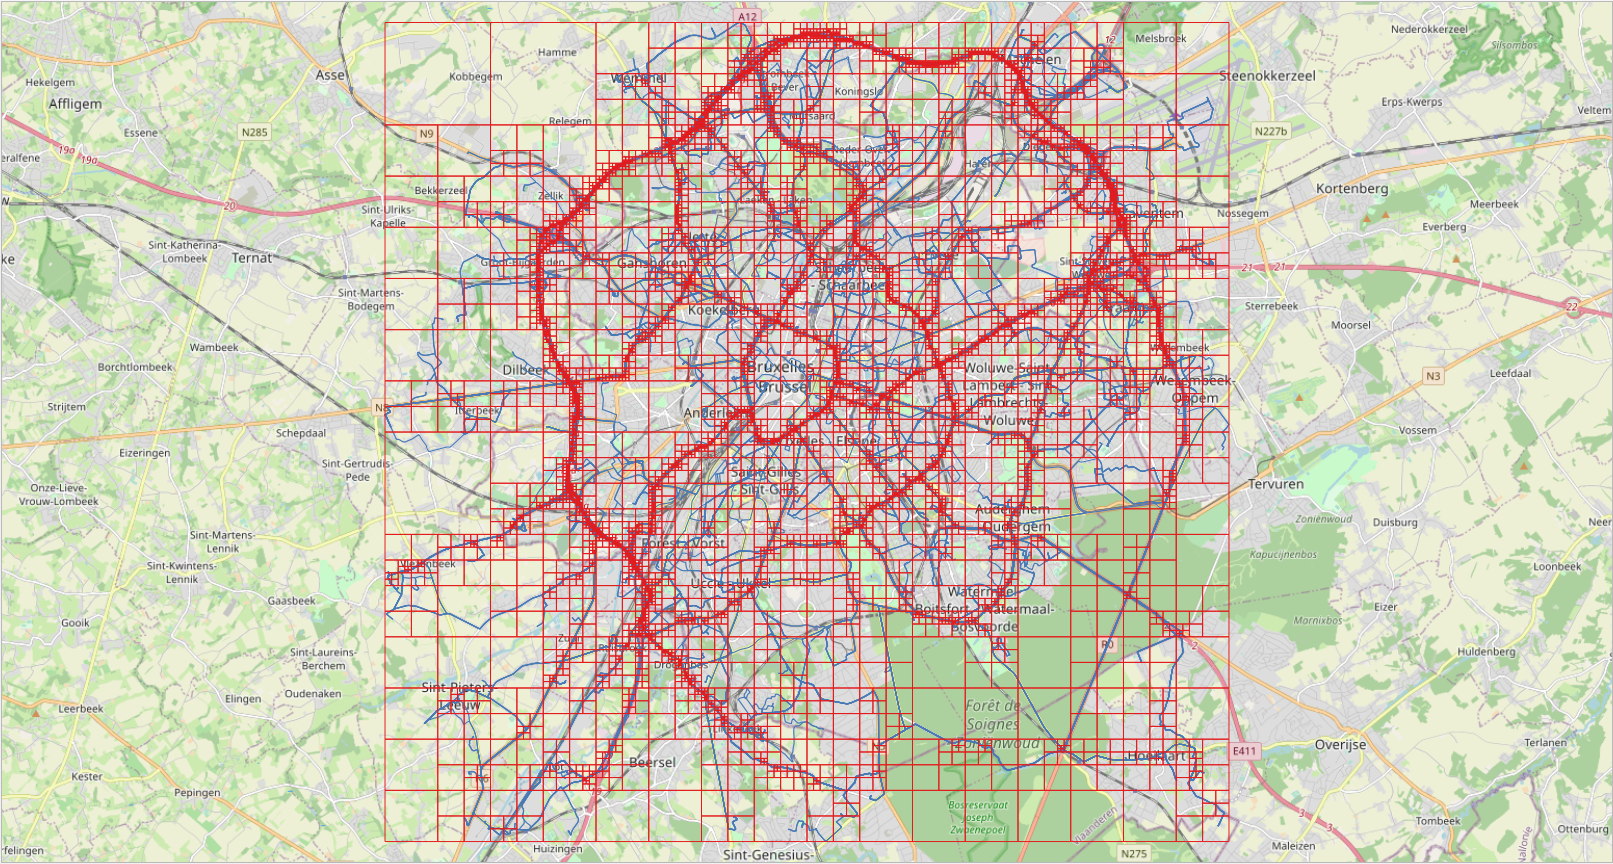
This function is typically used for multiresolution grids, where the space is split in cells such that the cells have a maximum number of elements. Figure 3.1, “Multiresolution grid on Brussels data obtained using the BerlinMOD generator. Each cell contains at most 10,000 (left) and 1,000 (right) instants across the entire simulation period (four days in this case). On the left, we can see the high density of the traffic in the ring around Brussels, while on the right we can see other main axes in the city.” shows an example of the result of using this function using synthetic trajectories in Brussels.
Figure 3.1. Multiresolution grid on Brussels data obtained using the BerlinMOD generator. Each cell contains at most 10,000 (left) and 1,000 (right) instants across the entire simulation period (four days in this case). On the left, we can see the high density of the traffic in the ring around Brussels, while on the right we can see other main axes in the city.

