In this workshop, we have used until now the BerlinMOD scenario, which models the trajectories of persons going from home to work in the morning and returning back from work to home in the evening during the week days, with one possible leisure trip during the weekday nights and two possible leisure trips in the morning and in the afternoon of the weekend days. In this section, we devise another scenario for the data generator. This scenario corresponds to a home appliance shop that has several warehouses located in various places of the city. From each warehouse, the deliveries of appliances to customers are done by vehicles belonging to the warehouse. Although this scenario is different than BerlinMOD, many things can be reused and adapted. For example, home nodes can be replaced by warehouse locations, leisure destinations can be replaced by customer locations, and in this way many functions of the BerlinMOD SQL code will work directly. This is a direct benefit of having the simulation code written in SQL, so it will be easy to adapt to other scenarios. We describe next the needed changes.
Each day of the week excepted Sundays, deliveries of appliances from the warehouses to the customers are organized as follows. Each warehouse has several vehicles that make the deliveries. To each vehicle is assigned a list of customers that must be delivered during a day. A trip for a vehicle starts and ends at the warehouse and make the deliveries to the customers in the order of the list. Notice that in a real-world situation, the scheduling of the deliveries requires to take into account customers' availability in a time slot of a day and the time needed to make the delivery of the previous customers in the list. We do not take into account these aspects in this simple simulation scenario.
To be able to run the delivery generator you need to execute the first two steps specified in the section called “Quick Start” to load the street network and prepare the base data for simulation, if not done already. The delivery generator can then be run as follows.
psql -h localhost -p 5432 -U dbowner -d brussels -f deliveries_datagenerator.sql
# adds the pgplsql functions of the simulation to the database

psql -h localhost -p 5432 -U dbowner -d brussels \
-c 'select deliveries_generate(scaleFactor := 0.005)'
# calls the main pgplsql function to start the simulation
If everything is correct, you should see an output like that starts with this:
INFO:  -----------------------------------------------------------------------
INFO:  Starting deliveries generation with scale factor 0.005
INFO:  -----------------------------------------------------------------------
INFO:  Parameters:
INFO:  ------------
INFO:  No. of warehouses = 7, No. of vehicles = 141, No. of days = 4
INFO:  Start day = 2020-06-01, Path mode = Fastest Path, Disturb data = f
...
The generator will take about one minute. It will generate deliveries, according to the default parameters, for 141 cars over 2 days starting from Monday, June 1st 2020. It is possible to generate more or less data by respectively passing a bigger or a smaller scale factor value. Please refer to the the section called “Customizing the Generator to Your City” to see all the parameters that can be used to customize the simulation, with the exception of the P_NEIGHBOURHOOD_RADIUS parameter, which is not used in this scenario.
We describe next the main steps in the generation of the deliveries scenario.
We start by generating the Warehouses table. Each warehouse is located at a random node of the network.
DROP TABLE IF EXISTS Warehouses;
CREATE TABLE Warehouses(WarehouseId int, NodeId bigint, Geom geometry(Point));
FOR i IN 1..noWarehouses LOOP
  INSERT INTO Warehouses(WarehouseId, NodeId, Geom)
  SELECT i, id, Geom
  FROM Nodes n
  ORDER BY id LIMIT 1 OFFSET random_int(1, noNodes);
END LOOP;
We create a table Vehicles with all vehicles and the associated warehouse. Warehouses are associated to vehicles in a round-robin way.
DROP TABLE IF EXISTS Vehicles;
CREATE TABLE Vehicles(VehicleId int PRIMARY KEY, Licence text, VehicleType text,
  Brand text, WarehouseId int);
FOR i IN 1..noVehicles LOOP
  licence = berlinmod_createLicence(i);
  type = VEHICLETYPES[random_int(1, NOVEHICLETYPES)];
  brand = NOVEHICLEBRANDS[random_int(1, NOVEHICLEBRANDS)];
  warehouse = 1 + ((i - 1) % noWarehouses);
  INSERT INTO Vehicles VALUES (i, licence, type, brand, warehouse);
END LOOP;
We create next the Trips and Destinations tables that contain, respectively, the list of source and destination nodes composing the delivery trip of a vehicle for a day, and the list of source and destination nodes for all vehicles.
DROP TABLE IF EXISTS Trips;
CREATE TABLE Trips(VehicleId int, day date, seq int, source bigint, target bigint,
  PRIMARY KEY (VehicleId, day, seq));
DROP TABLE IF EXISTS Destinations;
CREATE TABLE Destinations(id serial PRIMARY KEY, source bigint, target bigint);
-- Loop for every vehicle
FOR i IN 1..noVehicles LOOP
  -- Get the warehouse node
  SELECT w.node INTO warehouseNode
  FROM Vehicles v, Warehouses w
  WHERE v.vehicleId = i AND v.warehouse = w.WarehouseId;
  day = startDay;
  -- Loop for every generation day
  FOR j IN 1..noDays LOOP
    -- Generate delivery trips excepted on Sunday
    IF date_part('dow', day) <> 0 THEN
      -- Select a number of destinations between 3 and 7
      SELECT random_int(3, 7) INTO noDest;
      sourceNode = warehouseNode;
      prevNodes = '{}';
      FOR k IN 1..noDest + 1 LOOP
        IF k <= noDest THEN
          targetNode = deliveries_selectDestNode(i, noNodes, prevNodes);
          prevNodes = prevNodes || targetNode;
        ELSE
          targetNode = warehouseNode;
        END IF;
        IF targetNode IS NULL THEN
          RAISE EXCEPTION '    Destination node cannot be NULL';
        END IF;
        IF sourceNode = targetNode THEN
          RAISE EXCEPTION '    SourceNode and destination nodes must be different, node: %', sourceNode;
        END IF;
        -- Keep the start and end nodes of each subtrip
        INSERT INTO Segments VALUES (i, day, k, sourceNode, targetNode);
        INSERT INTO Destinations(source, target) VALUES (sourceNode, targetNode);
        sourceNode = targetNode;
      END LOOP;
    END IF;
    day = day + interval '1 day';
  END LOOP;
END LOOP;
For every vehicle and every day which is not Sunday we proceed as follows. We randomly chose a number between 3 and 7 destinations and call the function deliveries_selectDestNode for determining these destinations. This function choses a destination node which is different from the previous nodes of the delivery, which are kept in the variable prevNodes. Then, the sequence of source and destination couples starting in the warehouse, visiting sequentially the clients to deliver and returning to the warehouse are added to the tables Segments and Destinations.
Next, we compute the paths between all source and target nodes that are in the Destinations table. Such paths are generated by pgRouting and stored in the Paths table.
DROP TABLE IF EXISTS Paths;
CREATE TABLE Paths(seq int, path_seq int, start_vid bigint, end_vid bigint,
  node bigint, edge bigint, cost float, agg_cost float,
  -- These attributes are filled in the subsequent update
  Geom geometry, speed float, category int);
-- Select query sent to pgRouting
IF pathMode = 'Fastest Path' THEN
  query1_pgr = 'SELECT id, source, target, cost_s AS cost, '
    'reverse_cost_s as reverse_cost FROM edges';
ELSE
  query1_pgr = 'SELECT id, source, target, length_m AS cost, '
    'length_m * sign(reverse_cost_s) as reverse_cost FROM edges';
END IF;
-- Get the total number of paths and number of calls to pgRouting
SELECT COUNT(*) INTO noPaths FROM (SELECT DISTINCT source, target FROM Destinations) AS t;
noCalls = ceiling(noPaths / P_PGROUTING_BATCH_SIZE::float);
FOR i IN 1..noCalls LOOP
  query2_pgr = format('SELECT DISTINCT source, target FROM Destinations '
    'ORDER BY source, target LIMIT %s OFFSET %s',
    P_PGROUTING_BATCH_SIZE, (i - 1) * P_PGROUTING_BATCH_SIZE);
  INSERT INTO Paths(seq, path_seq, start_vid, end_vid, node, edge, cost, agg_cost)
  SELECT * FROM pgr_dijkstra(query1_pgr, query2_pgr, true);
END LOOP;
UPDATE Paths SET
  -- adjusting directionality
  Geom = CASE WHEN node = e.source THEN e.Geom ELSE ST_Reverse(e.Geom) END,
  speed = maxspeed_forward,
  category = berlinmod_roadCategory(tag_id)
FROM Edges e WHERE e.id = edge;
After creating the Paths table, we set the query to be sent to pgRouting depending on whether we have want to compute the fastest or the shortest paths between two nodes. The generator uses the parameter P_PGROUTING_BATCH_SIZE to determine the maximum number of paths we compute in a single call to pgRouting. This parameter is set to 10,000 by default. Indeed, there is limit in the number of paths that pgRouting can compute in a single call and this depends in the available memory of the computer. Therefore, we need to determine the number of calls to pgRouting and compute the paths by calling the function pgr_dijkstra. Finally, we need to adjust the directionality of the geometry of the edges depending on which direction a trip traverses the edges, and set the speed and the category of the edges.
We explain how to generate the trips for a number of vehicles and a number of days starting at a given day.
DROP TABLE IF EXISTS Deliveries;
CREATE TABLE Deliveries(DeliveryId int PRIMARY KEY, VehicleId int, Day date, noCustomers int,
  Trip tgeompoint, Trajectory geometry);
DROP TABLE IF EXISTS Segments;
CREATE TABLE Segments(DeliveryId int, seq int, source bigint, target bigint,
  Trip tgeompoint,
  -- These columns are used for visualization purposes
  trajectory geometry, sourceGeom geometry, PRIMARY KEY (DeliveryId, seq));
delivId = 1;
aDay = startDay;
FOR i IN 1..noDays LOOP
  SELECT date_part('dow', aDay) into weekday;
  -- 6: saturday, 0: sunday
  IF weekday <> 0 THEN
    FOR j IN 1..noVehicles LOOP
      -- Start delivery
      t = aDay + time '07:00:00' + createPauseN(120);
      -- Get the number of segments (number of destinations + 1)
      SELECT count(*) INTO noSegments
      FROM Trips
      WHERE VehicleId = j AND day = aDay;
      FOR k IN 1..noSegments LOOP
        -- Get the source and destination nodes of the segment
        SELECT source, target INTO sourceNode, targetNode
        FROM Trips
        WHERE VehicleId = j AND day = aDay AND seq = k;
        -- Get the path
        SELECT array_agg((Geom, speed, category) ORDER BY path_seq) INTO Path
        FROM Paths p
        WHERE start_vid = sourceNode AND end_vid = targetNode AND edge > 0;
        IF Path IS NULL THEN
          RAISE EXCEPTION 'The path of a trip cannot be NULL. '
            'SourceNode node: %, target node: %, k: %, noSegments: %', sourceNode,
              targetNode, k, noSegments;
        END IF;
        startTime = t;
        trip = create_trip(Path, t, disturbData, messages);
        IF trip IS NULL THEN
          RAISE EXCEPTION 'A trip cannot be NULL';
        END IF;
        t = endTimestamp(trip);
        tripTime = t - startTime;
        IF k < noSegments THEN
          -- Add a delivery time in [10, 60] min using a bounded Gaussian distribution
          deliveryTime = random_boundedgauss(10, 60) * interval '1 min';
          t = t + deliveryTime;
          trip = appendInstant(trip, tgeompoint_inst(endValue(trip), t));
        END IF;
        alltrips = alltrips || trip;
        SELECT Geom INTO sourceGeom FROM Nodes WHERE id = sourceNode;
        INSERT INTO Segments(DeliveryId, SeqNo, Source, target, trip, trajectory, sourceGeom)
          VALUES (delivId, k, sourceNode, targetNode, trip, trajectory(trip), sourceGeom);
      END LOOP;
      trip = merge(alltrips);
      INSERT INTO Deliveries(DeliveryId, VehicleId, day, noCustomers, trip, trajectory)
        VALUES (delivId, j, aDay, noSegments - 1, trip, trajectory(trip));
      delivId = delivId + 1;
      alltrips = '{}';
    END LOOP;
  END IF;
  aDay = aDay + interval '1 day';
END LOOP;
We start by creating the tables Deliveries and Segments. Then, the procedure simply loops for each day (excepted Sundays) and for each vehicle and generates the deliveries. For this, we first set the start time of a delivery trip by adding to 7 am a random non-zero duration of 120 minutes using a uniform distribution. Then, for every couple of source and destination nodes in a segment, we call the function create_trip that we have seen previously to generate the Trip. We add a delivery time between 10 and 60 minutes using a bounded Gaussian distribution before starting the trip to the next customer or the return trip to the warehouse and then insert the trip into the Segments table.
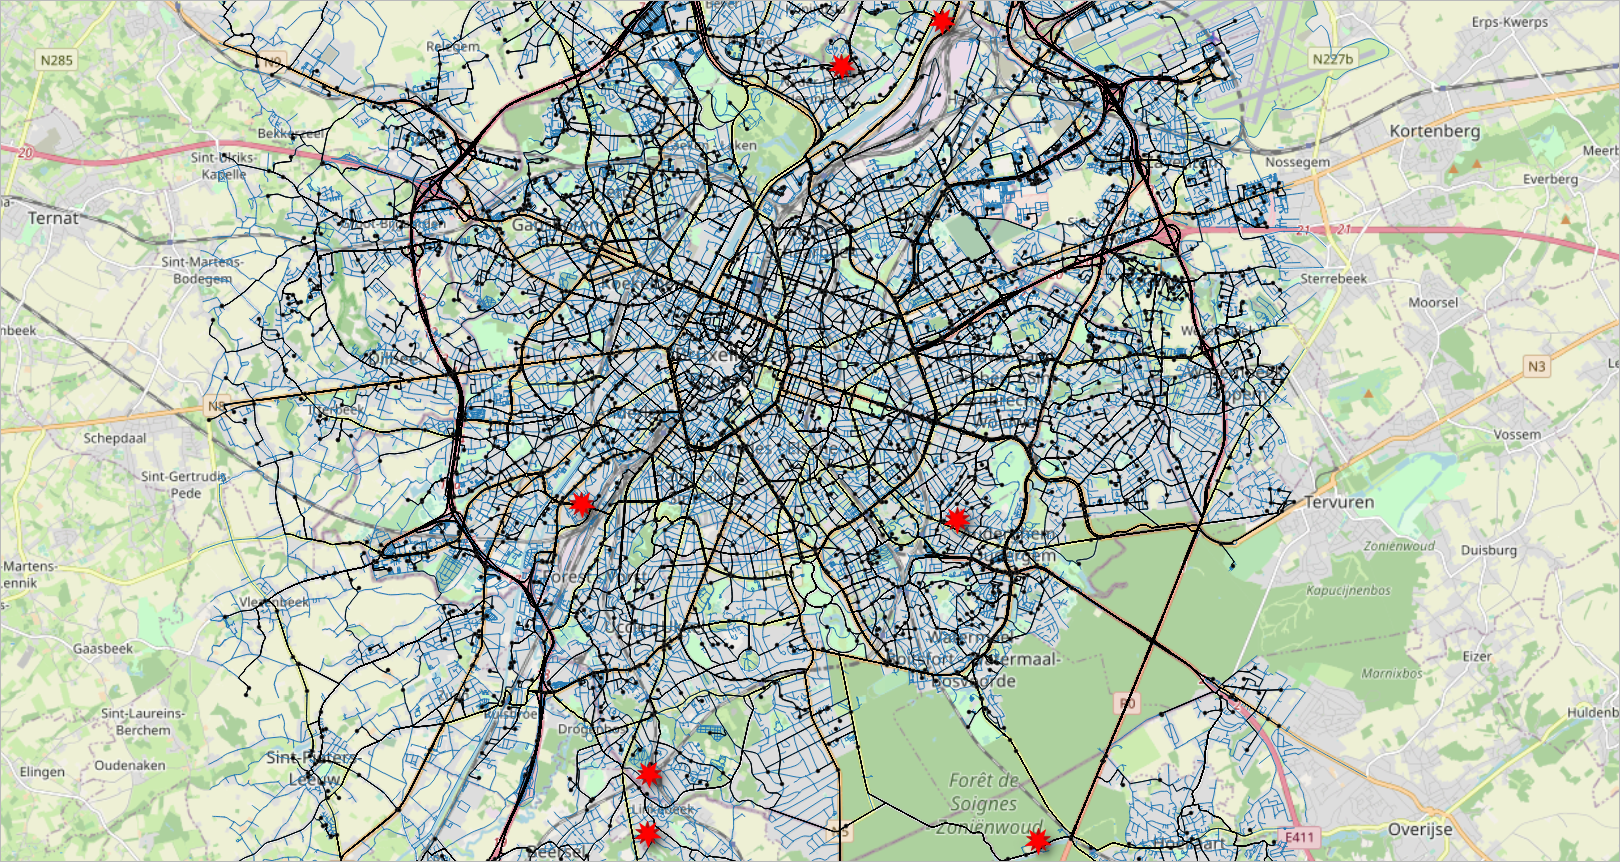
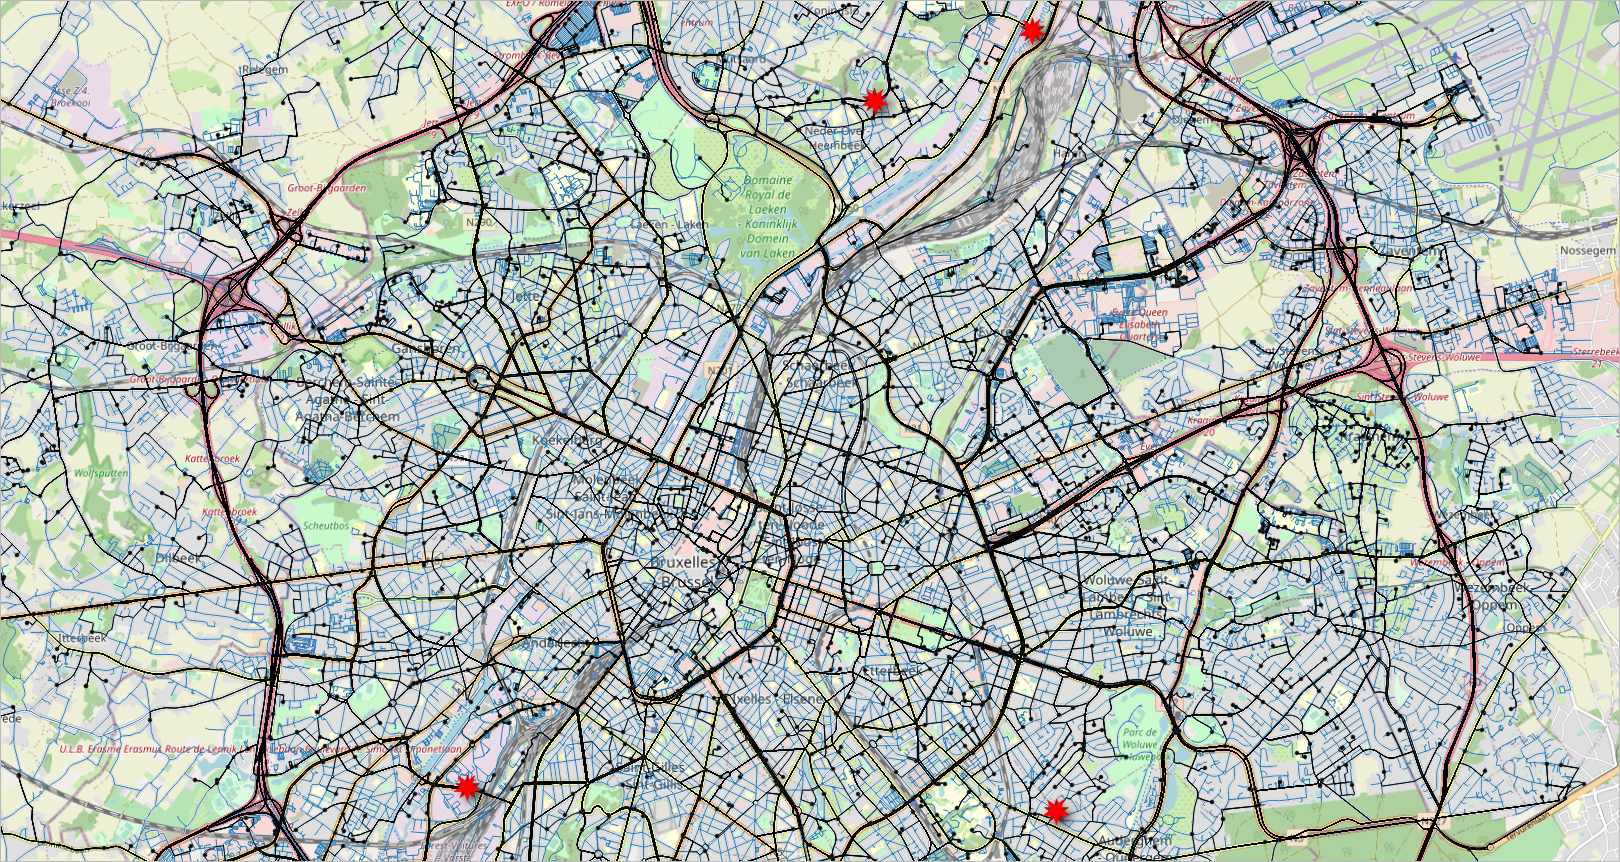
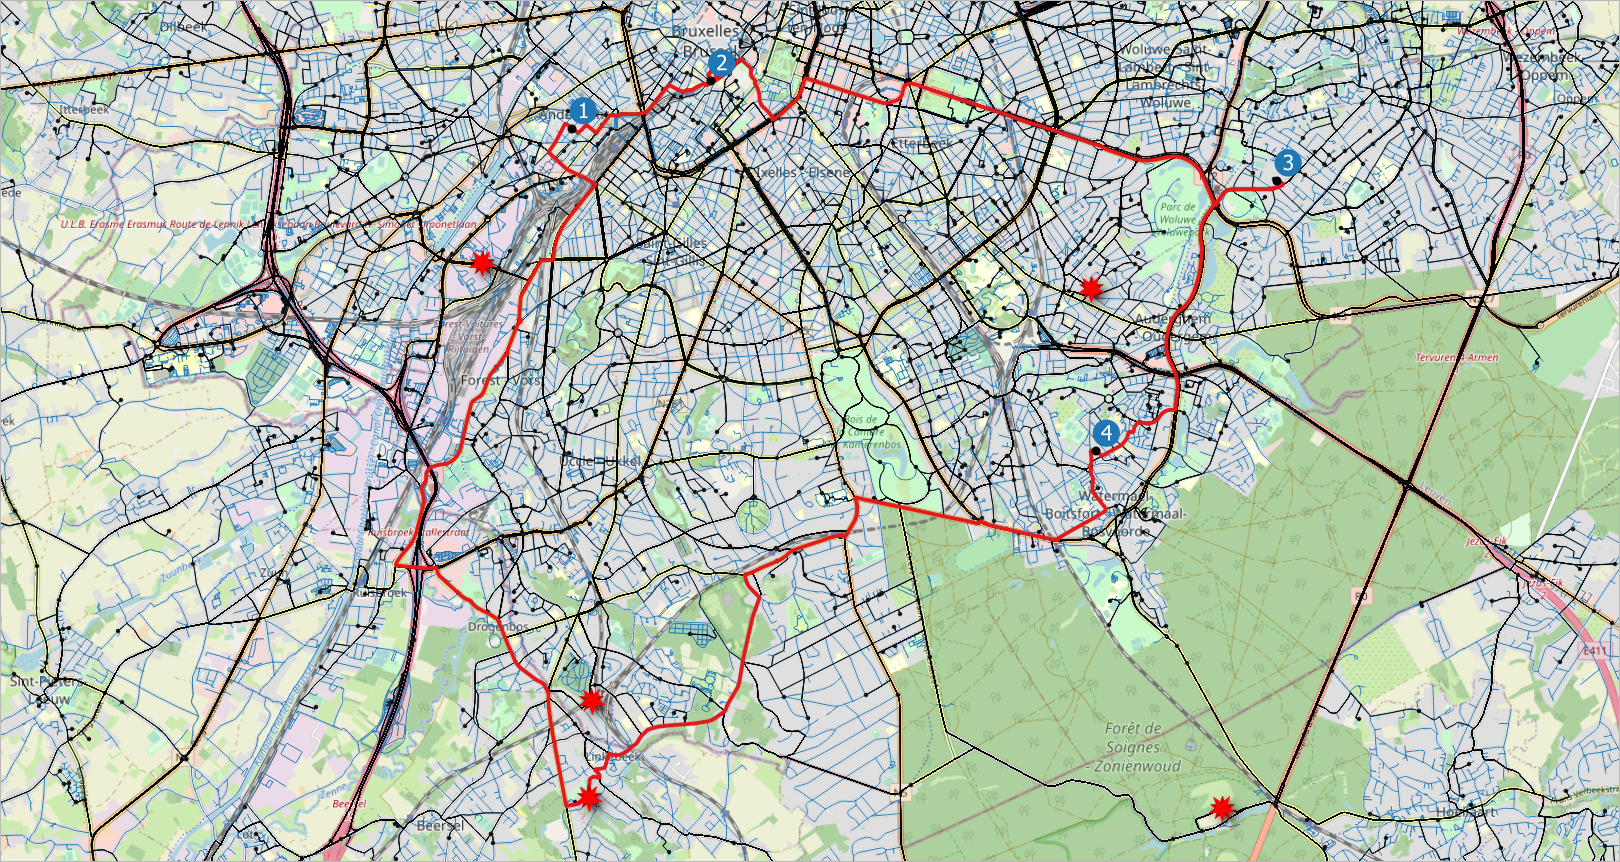
Figure 2.6, “Visualization of the data generated for the deliveries scenario. The road network is shown with blue lines, the warehouses are shown with a red star, the routes taken by the deliveries are shown with black lines, and the location of the customers with black points.” and Figure 2.7, “Visualization of the deliveries of one vehicle during one day. A delivery trip starts and ends at a warehouse and make the deliveries to several customers, four in this case.” show visualizations of the data generated for the deliveries scenario.